inquiry
Leave Your Message

How to Choose the Best Radar Speed Sign?

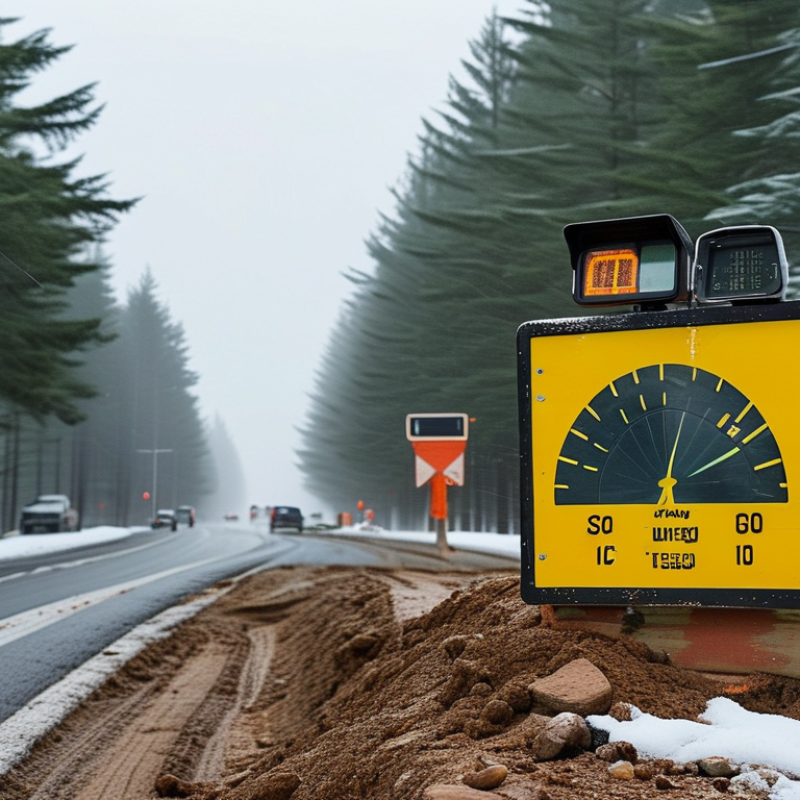
Choosing the best Radar Speed Sign begins with the road, not the product brochure. A school-zone entrance, rural curve, and busy urban street create different demands. Drivers need clear feedback before they reach a crossing, bend, or work area. The sign should display speed quickly, remain readable in sunlight, and avoid distracting visual effects.

Practical experience shows that detection range, display brightness, mounting height, and battery life strongly affect daily performance. A well-designed Radar Speed Sign can record traffic speeds, identify repeated patterns, and support informed traffic-management decisions. However, its value depends on correct placement and regular maintenance. Visibility matters. Dust on the solar panel, weak batteries, or a poor angle can reduce reliability. Weather resistance also deserves close attention, especially in areas with heavy rain, snow, or strong coastal winds.

A professional evaluation should compare accuracy, operating temperature, data access, warranty support, and installation requirements. Independent testing or manufacturer documentation can reveal details that marketing language sometimes hides. Check whether the system suits the road’s speed environment and complies with applicable local requirements. No device solves every speeding problem. Data can mislead. A short monitoring period may not represent weekday traffic, seasonal changes, or evening behavior. Field testing helps, even when the first choice seems obvious. The strongest decision balances measurable performance with real-world observations from drivers, maintenance teams, and traffic professionals. That careful process creates a more dependable investment and a safer, clearer roadside experience.
How to Choose the Best Radar Speed Sign?

Define the Road-Safety Goal Using 85th-Percentile Speed Data

How to Choose the Best Radar Speed Sign?

Define the Road-Safety Goal Using 85th-Percentile Speed Data

Choosing a radar speed sign should begin with measured traffic behavior, not a guessed speed limit. The 85th-percentile speed is the speed at or below which 85% of vehicles travel under free-flow conditions. It shows how drivers currently use the road.

Collect readings during representative periods. Avoid school arrival times, roadworks, storms, and unusual events. Record vehicle direction, lane position, date, and traffic volume. A sign with accurate radar detection and secure data storage can support this review. Small details matter.

Compare the 85th-percentile speed with the posted limit and the road’s physical design. A wide, straight street may encourage faster travel than nearby homes or crossings can safely tolerate. On a neighborhood road, the safety goal may involve reducing approach speeds near children, cyclists, or pedestrians. The sign should display clear, immediate feedback and remain readable in rain, darkness, and bright sunlight.

Do not treat one number as the entire answer. Crash history, sight distance, crossing activity, and roadside development also deserve attention. Our first field review might miss a short period of unusually fast traffic. That is a useful warning. Repeat measurements after installation, then compare the new 85th-percentile speed with the baseline. If speeds remain high, inspect placement, display visibility, and driver response before choosing stronger measures.

Match Radar Detection Range and Accuracy to Road Geometry

How to Choose the Best Radar Speed Sign?

Match Radar Detection Range and Accuracy to Road Geometry

Radar range should follow the road, not the product brochure. On a straight approach, a longer detection range can identify vehicles early and display a warning smoothly. However, a wide beam may capture traffic from adjacent lanes, driveways, or side streets. Geometry decides.

NHTSA’s 2022 Traffic Safety Facts reported 12,151 speeding-related fatalities, representing 29% of all traffic deaths in the United States. That figure supports careful speed feedback, but detection quality still matters. On a two-lane road, check whether the radar can isolate the approaching lane. Near a curve, crest, or downhill section, reduce the expected range and test target stability. A vehicle behind the sign should not trigger the display first.

Mounting angle also affects accuracy. Radar measures motion relative to its sensor, so excessive angle can produce a lower measured speed. Narrow approaches usually need tighter beam control. Multilane roads may require lane-specific testing. Shorter is safer.

Field verification is essential. The Federal Highway Administration’s Speed Management guidance emphasizes matching countermeasures to roadway context, operating speed, and user behavior. I would not trust a single setup reading. Record speeds at different distances, times, and traffic volumes. Rain, metal fencing, parked vehicles, and road curvature can create misleading returns. A practical choice is the range that delivers stable, repeatable readings where drivers can still react—not the range with the largest number.

Compare Sign Visibility, Display Size, and MUTCD Compliance

How to Choose the Best Radar Speed Sign?

Choosing a radar speed sign starts with visibility, not decoration. Drivers need to notice it quickly, understand it clearly, and react safely. In field evaluations, bright sunlight, rain, glare, and roadside clutter often reduce readability. A high-contrast display helps, but brightness must remain controlled at night. Excessive brightness can distract drivers or reduce trust in the message.

Display size should match the road environment. A compact sign may work near a low-speed neighborhood entrance. Wider roads, higher approach speeds, and longer viewing distances usually require larger numerals. Test the sign from the driver’s perspective, not from the sidewalk. Can a driver read it before reaching the decision point? Not always. A larger display is not automatically better if its mounting height or viewing angle is poor.

MUTCD compliance deserves careful review. Check the current edition, applicable state supplements, and local traffic authority requirements before installation. These rules may affect sign placement, colors, legends, dimensions, and operating features. The sign should support an approved traffic-control plan rather than replace one. Documentation also matters: record visibility tests, speed settings, installation measurements, and maintenance checks. Small details become important later. Avoid choosing equipment from a specification sheet alone; real roadside conditions may expose weaknesses that laboratory testing misses.

Evaluate Speed-Reduction Results Against the Typical 2–5 mph Effect

How to Choose the Best Radar Speed Sign?

A radar speed sign should be judged by measured speed reduction, not brightness or display size. The Federal Highway Administration’s Traffic Calming ePrimer reports typical reductions of about 2–5 mph for speed feedback signs. Results vary with road design, traffic volume, sign placement, and driver familiarity. That range is a benchmark, not a promise.

Collect baseline data for at least one normal week before installation. Record the 85th-percentile speed, average speed, traffic volume, and speeding frequency. Then repeat the same measurements after 30, 60, and 90 days. A sign that lowers the 85th-percentile speed by 4 mph may perform better than one producing a brief 7 mph drop during its first week. Short-term excitement can distort results.

Look for independent evaluation methods. The National Cooperative Highway Research Program has emphasized consistent before-and-after measurement when assessing speed-management treatments. Compare similar weekdays, weather conditions, and time periods. Check whether speeds rise again after drivers become accustomed to the display. That weakness matters. I have seen evaluations focus only on average speed, while a smaller group of dangerous high-speed drivers remained unchanged. A reliable sign should also provide readable feedback at the approach distance, store data securely, and support adjustable speed thresholds. Do not choose by appearance alone. Measure the result. Expect only 2–5 mph, and question any claim that promises far more.

How to Choose the Best Radar Speed Sign? - Evaluate Speed-Reduction Results Against the Typical 2–5 mph Effect

Evaluation Dimension What to Measure Reference Data or Formula How to Interpret the Result
Free-flowing speed reduction Compare the same percentile speed before and after installation, preferably the 85th-percentile speed. Speed reduction = baseline speed − post-installation speed. A typical radar speed sign effect is approximately 2–5 mph. Less than 2 mph: limited effect. 2–5 mph: typical effect. More than 5 mph: strong result that should be checked over multiple measurement periods.
85th-percentile speed The speed at or below which 85% of measured vehicles travel. Example calculation: 85th-percentile baseline of 38 mph and post-installation value of 34 mph produce a 4 mph reduction. Use the same road segment, travel direction, time window, and weather conditions for both measurements.
Mean operating speed Average speed of eligible vehicles, excluding stopped or unusually slow vehicles according to the study protocol. Mean-speed reduction = baseline mean speed − post-installation mean speed. A useful secondary metric, but it should not replace the 85th-percentile speed because averages can hide high-speed behavior.
Speed-limit compliance Percentage of vehicles traveling at or below the posted speed limit. Compliance rate = vehicles at or below the limit ÷ total eligible vehicles × 100. A higher compliance rate indicates improved behavior, even when the average speed changes only modestly.
High-speed violations Count vehicles traveling more than 5, 10, or 15 mph above the posted limit. Violation-rate change = baseline violation rate − post-installation violation rate. A decline in extreme speeds is particularly important on roads near schools, crossings, work zones, and pedestrian activity.
Traffic volume Number of eligible vehicles recorded during each comparison period. Record volume together with speed data so that unusual traffic levels do not distort the result. Compare similar weekdays, hours, seasons, and traffic conditions. A speed change based on a very small sample is less reliable.
Observation period Duration of baseline and post-installation data collection. Use multiple comparable observation periods rather than a single short measurement session. Longer and repeated measurements help distinguish a sustained sign effect from temporary driver attention.
Driver response distance Measure speed at the sign and at one or more downstream points. Compare immediate speed reduction with the speed retained farther downstream. A sign is more effective when lower speeds persist beyond the sign rather than occurring only at the display.
Display activation rate Percentage of eligible vehicles that trigger a visible speed message. Activation rate = vehicles triggering the display ÷ eligible vehicles × 100. Very low activation may indicate an unsuitable speed threshold, poor placement, or inadequate detection range.
Visibility and readability Check legibility in daylight, darkness, rain, glare, and different approach angles. Document viewing distance, mounting position, display contrast, and any obstructions. A technically accurate sign cannot reduce speeds reliably if drivers cannot see or understand it in time.
Data quality Check radar accuracy, vehicle classification, timestamp consistency, missing records, and duplicate detections. Exclude invalid observations using the same rules for baseline and post-installation datasets. Reliable data is essential before declaring a sign effective or ineffective.
Decision benchmark Compare the observed change with the expected typical effect. Observed reduction ÷ 2–5 mph reference range, reported together with sample size and measurement conditions. Do not judge a sign using speed reduction alone; combine speed, compliance, extreme-speed, visibility, and durability results.

Note: The 2–5 mph range is a general reference benchmark, not a guaranteed outcome. Actual results vary with road design, posted speed limit, sign placement, traffic conditions, enforcement presence, weather, and driver familiarity with the location.

Select Power, Connectivity, and Weather Protection for Local Conditions

Choosing the best radar speed sign starts with the road, not the display size. Observe traffic volume, vehicle speeds, and available power before comparing features. A rural road may need solar power with a large battery. A town entrance may have reliable mains electricity and regular data access. During field inspections, check shade, winter cloud cover, and nearby trees. Solar performance can drop sharply in these conditions. That detail is easy to miss.

Connectivity should match the maintenance routine. Local storage may suit a quiet road inspected monthly. Cellular or wireless access helps teams review speed data without opening the cabinet. However, signal strength can change behind hills or concrete structures. Test the exact mounting point, not just a nearby phone signal. Secure settings and authenticated access also protect operational records. Collect only useful data. More data is not always better.

Weather protection must reflect local exposure. Consider sealed housing, corrosion-resistant fittings, and impact-resistant materials for rain, dust, salt, or snow. Check ingress ratings, operating temperatures, and drainage details in technical documents. A strong enclosure still needs clean vents and intact cable glands. I have seen neglected seals cause more trouble than weak electronics. No option is perfect. Recheck the installation after storms and seasonal temperature changes, especially where freezing water can enter small gaps.